
The need for Infrastructure Monitoring
In today’s fast paced and intensely competitive environment, businesses of all types, from digital natives to large organizations, increasingly rely on managed service providers (MSP) in order to gain technological edge on their peers and enhance the operational efficiency and security of their digital assets.
According to a recent study, 98% of organizations report that a single hour of downtime can cost over $100,000. Hence the need for consistent infrastructure monitoring to ensure seamless business operations and service uptime.
This is where our proactive monitoring services come into play. If you’re not familiar with how this works, this article will shed a light on the monitoring service.
What is Infrastructure Monitoring?
Infrastructure monitoring is the continuous scanning of an organization’s digital systems to ensure they are running optimally and securely. The idea is to monitor specific metrics in order to preemptively detect anomalies and intervene before a disruption occurs.
For businesses partnering with Managed Service Providers (MSPs), this kind of vigilance is crucial. After all, it’s the MSP’s job to catch and fix problems before they escalate, which means less downtime and more productivity for the business.
The benefits of investing in monitoring and observability services are many. As they track every measurable aspect of the infrastructure from network traffic and performance to system health, they can identify irregularities that could signal a security breach or a performance overrun.
It’s a proactive stance on maintenance that helps in immediate threat detection. On top of it, a monitoring service also aids in strategic planning and capacity management for system upgrades. If anything, it guarantees that businesses stay ahead of the curve at all times.
How Infrastructure Monitoring Works
Modern-day infrastructure monitoring involves a blend of techniques to keep a vigilant eye on digital and IT systems. The goal is simply to ensure they operate smoothly and securely.
The process uses intricate telemetry data, including logs, metrics, events, and system traces. All of these help provide a comprehensive view of the digital and IT infrastructure performance and health.
This approach enables businesses, especially those working with Managed Service Providers (MSPs), to preemptively address issues, optimize system performance, and maintain security protocols effectively, at all times.
Monitoring integrates both passive and active monitoring methods. For starters, passive monitoring analyzes system logs to track performance without affecting system operations. Active monitoring, on the other hand, employs real-time probes and agents to detect and address issues as they occur. This combination allows MSPs to take immediate corrective actions and keep the system optimized.
All in all, infrastructure monitoring tools are essential for identifying potential bottlenecks, ensuring resource availability, and safeguarding against cyber threats.
Key Components of Infrastructure Monitoring
Infrastructure monitoring is a broad term that involves a lot of different components. They even vary from business to business. In this section, let us try and list the most common components of critical infrastructure monitoring.
- Agents: These are specialized software installed directly on physical servers, virtual machines or on kubernetes nodes. These agents are responsible for collecting a wide range of infrastructure metrics from the hosts they reside on, such as performance data and resource utilization. The data is then sent to a monitoring platform for further analysis and visualization.
- Observability (o11y) and Visibility Across Layers: Infrastructure monitoring offers a comprehensive view across multiple layers of the technology stack. These layers include the physical hardware components like memory chips and processors. Then, there are the application layers where the tools do their job. It’s the operating system that serves as an intermediary between hardware and application layers. This multi-layered single-pane-of-glass insight is crucial for understanding the health and performance of backend components that support user-facing applications.
- Metrics Analysis: This is a very important component of IT monitoring and alerting. It involves analysis of specific resource metrics including CPU Utilization, memory utilization, and storage usage. The purpose is to measure the processing capacity, short-term storage usage for running programs, and the disk space used for storing files and content. These metrics help identify when resources are under strain or potentially misallocated, allowing for timely adjustments.
- Use Cases: The practice is instrumental in troubleshooting performance issues, optimizing the use of infrastructure to lower costs, and forecasting future backend requirements based on historical data. This enables operations teams, DevOps engineers, and site reliability engineers (SREs) to maintain high availability and performance of services, manage costs effectively, and plan for growth or increased demand.
- Challenges and Solutions: Adapting to the dynamic environments of cloud infrastructure, overcoming cultural silos within organizations, and choosing the right tools that offer cloud-native support, machine learning capabilities for anomaly detection, and comprehensive dashboards for visualization are among the challenges faced. Solutions involve leveraging modern infrastructure monitoring tools that integrate with cloud services and provide a unified platform to correlate infrastructure metrics with application performance data, facilitating a more cohesive and effective monitoring strategy.
Types of Infrastructure Monitoring
Broadly speaking, there are two main types of infrastructure monitoring. Let’s understand them in a little bit more detail.
Agentless Monitoring
Agentless monitoring is a method where the system’s performance and health data are gathered without installing dedicated software, or agents, on each target device. This approach relies on the existing protocols, APIs and services within the network to collect necessary information.
In case you’re wondering, it’s particularly beneficial for overseeing devices where installing an agent is impractical or for environments that prioritize minimal system impact.
Agentless monitoring is also easier to maintain across a large and diverse infrastructure as it reduces the overhead associated with updates and management of monitoring software on every device. It is today the preferred method to monitor services residing in cloud environments, for example Microsoft Graph can be accessed through API and will provide valuable insights into Microsoft 365 or Azure environments.
Agent Monitoring
It involves deploying a piece of software, known as an agent, on each device or server that needs to be monitored.
The job of this agent is to collect detailed data about the device’s performance, resource usage, and health status. Then, it sends this information to a central monitoring system for analysis and alerting. Of course, it’s part of the MSP service you take.
Agent monitoring provides in-depth insights into system behavior and is highly effective in identifying and diagnosing issues quickly. However, it requires that each monitored device supports the agent software, and there’s an overhead in managing and updating agents across the infrastructure.
Key Metrics and Parameters
Another important question when it comes to infrastructure monitoring is what are the metrics to look for. Of course, the list can be massive depending on what type of business we’re dealing with.
The idea is to select the important metrics, define a threshold above which things might be critical and then create visual and programmatic alerts in order to engage the relevant resources when this threshold is reached in order to solve the matter before it becomes an incident.
But here go the most common monitoring parameters.
- CPU Utilization: As you’d expect from the title, it measures the percentage of the CPU’s capacity that is being used. High values during a large period of time (i.e. more than 15 minutes) may indicate that the CPU is overworked, potentially leading to slower performance. After the MSP detects it, it’ll take care of the extra load by delegating it to other servers.
- Memory Utilization: The memory is another critical part of the hardware layer. Memory utilization Indicates the amount of RAM in use versus the total available. High memory usage can lead to application slowdowns or crashes if the system runs out of available memory.
- Disk I/O: Tracks the read and write operations on the disk. Monitoring disk I/O can help identify bottlenecks in data access and potential hardware failures.
- Connections per second: Tracks the number of incoming connections on a system per second, this is a good KPI to monitor in order to correctly drive system capacity management.
- Network Throughput: Measures the amount of data transferred over a network in a given time frame. It helps identify network capacity issues or potential breaches in data transfer policies.
- Error Rates: The frequency of errors generated by applications or systems. A high error rate could signal underlying issues with software or hardware that need investigation.

Observability dashboard for SQL server metrics
Tools and Technologies
Infrastructure monitoring employs a variety of tools and technologies designed to ensure system health and performance. This includes software solutions (like Dynatrace) that offer comprehensive monitoring capabilities across networks, computing infrastructure and applications.
These platforms typically provide features for real-time alerting, data visualization through dashboards, and historical data analysis to identify trends.
Additionally, cloud-native tools such as AWS CloudWatch and Azure Monitor cater specifically to cloud infrastructures, something MSPs commonly use and interface with their existing observability (o11y) systems. They offer integration with cloud services for detailed insights and analytics.
Benefits of Effective Infrastructure Monitoring
Infrastructure monitoring offers numerous benefits that enhance IT operations and business processes:
Proactive Issue Resolution
Digital infrastructure monitoring identifies potential problems before they escalate to reduce downtime and maintain business continuity.
Performance Optimization
Monitoring system and application performance in real-time allows adjustments to improve efficiency and user experience.
Cost Reduction
Monitoring helps identify over provisioned resources and take initiatives for cost savings by optimizing resource allocation.
Security Enhancement
It also detects unusual activity that may indicate security threats and prevent breaches before they occur.
Compliance Assurance
Monitoring ensures systems are updated according to regulatory standards by monitoring for compliance-related metrics.
Capacity Planning
Monitoring provides data for informed decision-making regarding future infrastructure needs based on trends and usage patterns
Exeo Managed Monitoring Service
As an MSP, we proactively monitor and track critical infrastructure metrics to ensure uptime and optimal operation of the assets we manage for our clients. As we started engaging with application developers and integrators, including teams building on our EXEO Forge managed app platform, the need for more detailed reporting emerged, beyond infrastructure uptime and extending to the health of applications and their underlying platforms and databases.
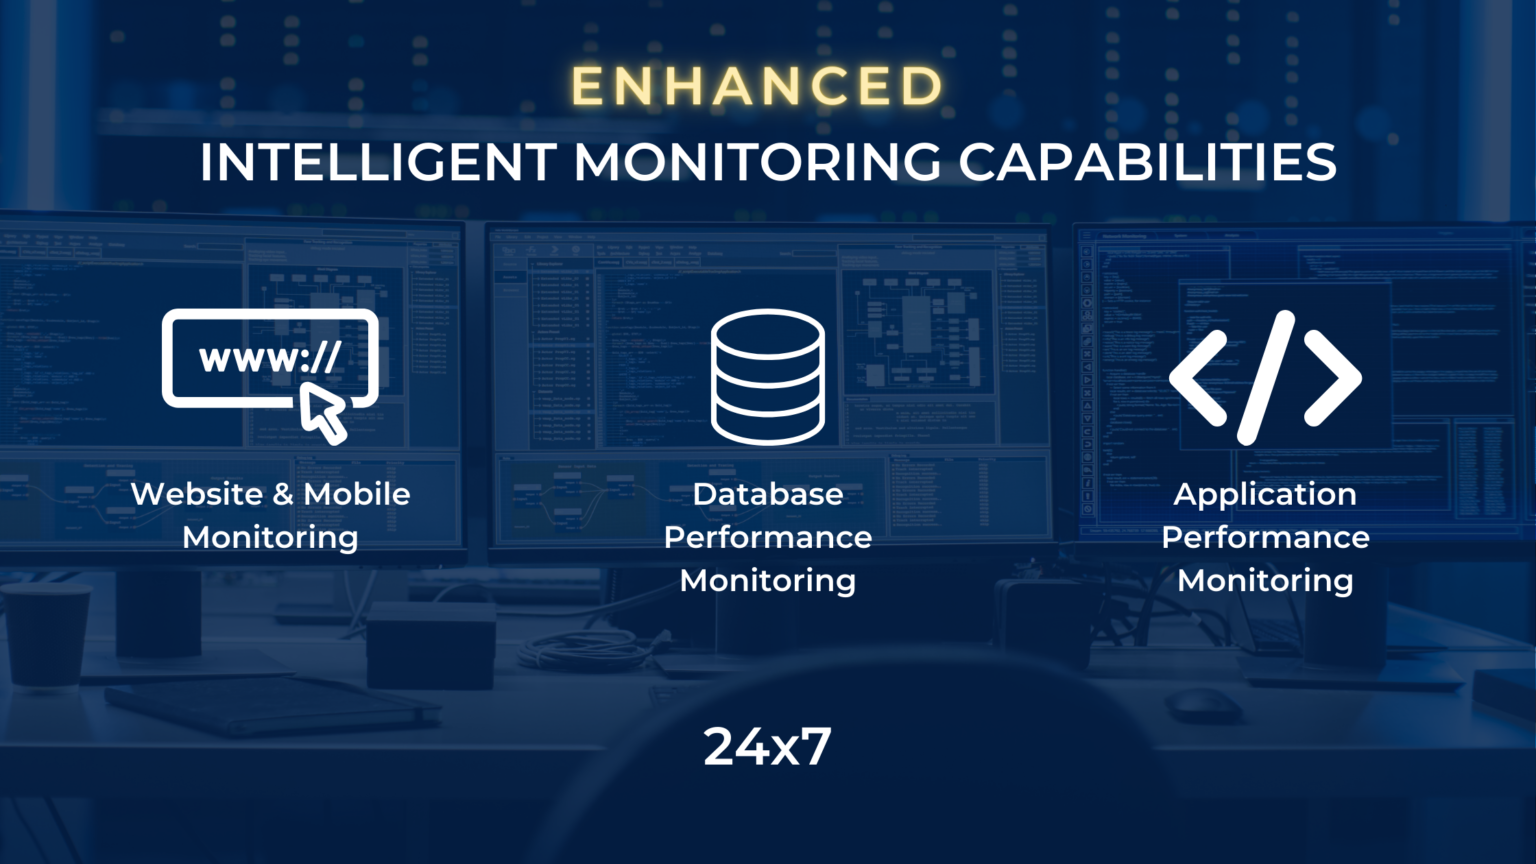
For this reason, we extended our monitoring practice with three capabilities:
- Website and mobile app monitoring;
- Database performance monitoring;
- Application performance monitoring.
This service provides immediate results without requiring the client to buy additional software or perform complex installations.
Website and Mobile App Monitoring
Website uptime monitoring is a vital aspect for ensuring the continuous availability and reliability of a website. It involves tracking various metrics to assess the health and performance of a website.
Here’s a breakdown of the key metrics included in this comprehensive monitoring approach:
- Website Uptime: We track the continuous availability of your website to users;
- SSL Certificate: We track the sanity and expiry of the SSL certificates that secure your sites;
- Domain Expiry: We monitor the expiration date of your website’s domain to prevent potential disruptions;
- Brand Reputation: We monitor the website pages for malicious code or any threat that can blacklist your website or make it to any block list database;
- Website Transactions: We execute transactions on your website on a regular basis to make sure the application is not broken;
- API Monitoring: Tracking the sanity of your REST or SOAP based APIs;
- Website Defacement: We detect unauthorized alterations to your website’s visual and content integrity;
- Mobile App Transaction Monitoring: We track the successful completion of actions within your mobile app, such as in-app purchases or user interactions, to ensure app reliability and user satisfaction.
Database Performance Monitoring
Database Performance Monitoring involves tracking the efficiency and responsiveness of your database systems. It ensures that databases operate optimally, handling data requests efficiently, minimizing bottlenecks, and maintaining data integrity. This monitoring is essential for delivering high-performance applications and maintaining a seamless user experience.
As par of this service we help developers detect which queries are creating bottlenecks in the application and provide insights into optimising the overall database structure.
This service requires installing a small agent on the database server.

Database monitoring
Application Performance Monitoring
Application Performance Monitoring (APM) is a comprehensive approach to track and optimize the performance of your software applications. It provides real-time insights into application behavior, user experience, and system dependencies. APM helps pinpoint issues, bottlenecks, and errors, allowing for rapid troubleshooting and improvement.
By monitoring key metrics like response times, error rates, and resource utilization, APM ensures your applications run smoothly, delivering a seamless user experience and enhancing overall reliability.
As part of this service, we help developers identify problematic functions and enhance the overall performance of their code and applications.

Application Performance Monitoring
Conclusion
Infrastructure monitoring keeps your systems available, fast and predictable. It surfaces problems before they reach your users, guides capacity decisions, and gives your teams a single view across servers, cloud, databases and applications.
EXEO runs this as a managed service across France, Lebanon and the UAE, from infrastructure uptime to website, database and application performance, alongside your business continuity plan. If you want proactive monitoring without buying and running the tooling yourself, talk to our team or explore our managed services.
Frequently Asked Questions
What is infrastructure monitoring?
Infrastructure monitoring is the continuous collection of metrics, logs, events and traces from your servers, networks, cloud services and applications. The goal is to detect anomalies early and act before they turn into downtime. For an organization working with a managed service provider, it means issues are caught and resolved before they reach your users.
What is the difference between agent and agentless monitoring?
Agentless monitoring collects data through existing protocols and APIs, without installing software on each device. It suits cloud services and environments where a light footprint matters. Agent monitoring installs a small piece of software on the host to gather deeper metrics on performance, resource usage and health. We combine both, based on what each system needs.
What is the difference between infrastructure monitoring and application performance monitoring (APM)?
Infrastructure monitoring watches the health of the underlying layers: CPU, memory, disk, network and system uptime. Application performance monitoring (APM) looks inside the application itself, tracing response times, error rates and slow functions in the code. You need both to connect a user-facing slowdown to its root cause. EXEO delivers both under one service.
Which metrics should you monitor?
The core parameters are CPU utilization, memory utilization, disk I/O, connections per second, network throughput and error rates. For each one we set a threshold, then trigger alerts that engage the right team before the threshold becomes an incident. The exact metric set depends on your workloads and applications.
Do I need to buy monitoring software to use EXEO's service?
No. The service provides immediate results without requiring you to buy additional software or run complex installations. We operate the platform and integrate with your environment. Where deeper insight is needed, such as database or application monitoring, we deploy a small agent on the relevant server.
How is infrastructure monitoring different from a managed SOC?
A managed SOC monitors your environment for security threats and responds to incidents. Infrastructure monitoring watches availability, performance and capacity to keep systems running well. The two are complementary. If you need security monitoring and response, see our Managed SOC services. For uptime and performance, this monitoring service is the right fit.
What does EXEO monitor beyond infrastructure?
Beyond infrastructure uptime, we monitor three additional layers: website and mobile app availability, including SSL, domain expiry, transactions and API health; database performance; and application performance. This gives developers and operations teams a single view from the hardware up to the user experience.
How quickly can EXEO set up monitoring?
The service is built for fast onboarding. Because it needs no software purchase, and only a light agent where deeper monitoring applies, we can start tracking your critical assets quickly and integrate with your existing systems and dashboards.
Which monitoring tools does EXEO use?
We work with enterprise-grade observability platforms such as Dynatrace, and we integrate with cloud-native tools like AWS CloudWatch and Azure Monitor. We connect these to your existing systems so infrastructure metrics and application performance data sit in one place.